BNB, VET, RNDR and KAS flash bullish as Bitcoin bulls fight to hold $52K

Bitcoin could face headwinds at $52,000, but BNB, KAS, VET, and RNDR may continue to move higher.
Inflows into the spot Bitcoin exchange-traded funds (ETFs) topped $2.2 billion between Feb. 12 and Feb. 16, indicating a strong investor appetite. Bloomberg analyst Eric Balchunas said in a X post that BlackRock’s iShares Bitcoin Trust (IBIT) has attracted year-to-date inflows of $5.2 billion, which is “50% of BlackRock’s total net ETF flows, out of 417 ETFs.”
Bitcoin continued its rally this week, rising about 7%, but the bulls are facing stiff resistance near $52,000. One of the near-term concerns is the potential selling of roughly $1.3 billion worth of Grayscale Bitcoin Trust shares by bankrupt crypto lending firm Genesis to reimburse creditors.
If Bitcoin consolidates in the short term, the action may shift to altcoins. Select altcoins that have broken above their respective overhead resistance levels in the past few days are likely to witness a continuation of the rally.
Could Bitcoin avoid a sell-off in the short term? If it does, let’s look at the charts of the top 5 cryptocurrencies that may extend their up move.
Bitcoin price analysis
Bitcoin has been facing selling near $52,000. The bears tried to sink the price below $50,000 on Feb. 17, but the long tail on the candlestick shows solid buying on dips.
A shallow correction from the $52,000 resistance shows that the bulls are not booking profits in a hurry as they anticipate the uptrend to continue. If the price breaks and sustains above $52,000, the BTC/USDT pair could start its northward march to $60,000.
A minor risk to the continuation of the rally is that the relative strength index (RSI) has stayed in the overbought territory for some time. This indicates that the rally may be overheated in the near term.
The bears will have to yank the price below the 20-day exponential moving average ($47,809) to indicate the start of a corrective phase. The pair may then slide to the 50-day simple moving average ($44,441).
The bears pulled the price below the 20-EMA on the 4-hour chart but could not sustain the lower levels. This suggests that the bulls are trying to protect the level with vigor. Buyers will have to overcome the obstacle at $52,817 to increase the possibility of a rise to $55,000.
If bears want to prevent the upside, they will have to drag the price below the moving averages. The pair may then collapse to the breakout level of $48,970. The bulls will try to guard this level, but if they fail in their endeavor, the pair may descend to $47,000 and eventually to $44,700.
BNB price analysis
BNB is in an uptrend, but the rally is facing headwinds near the stiff resistance at $360. A minor positive is that the bulls have not ceded ground to the bears.
The upsloping 20-day EMA ($328) and the RSI near the overbought territory indicate that the path of least resistance is to the upside. If buyers achieve a close above $360, the BNB/USDT pair could start the next leg of the journey to $400. This level may prove to be a difficult hurdle to cross, but if overcome, the next stop could be $460.
Conversely, if the price closes below $348, the short-term traders may book profits. That could start a correction to the 20-day EMA and then to the 50-day SMA ($313). A short-term trend change will be signaled if the pair closes below the 50-day SMA.
The bulls are trying to defend the 20-EMA on the 4-hour chart, but the bears have kept up the pressure. If the price turns up from the current level, the bulls will attempt to push the pair to $366. A break above this resistance will indicate the resumption of the uptrend. The pair may then rise to $400.
Contrarily, if the price remains below the 20-EMA, it will indicate that the bears are on a comeback. The pair may then tumble to the 50-SMA.
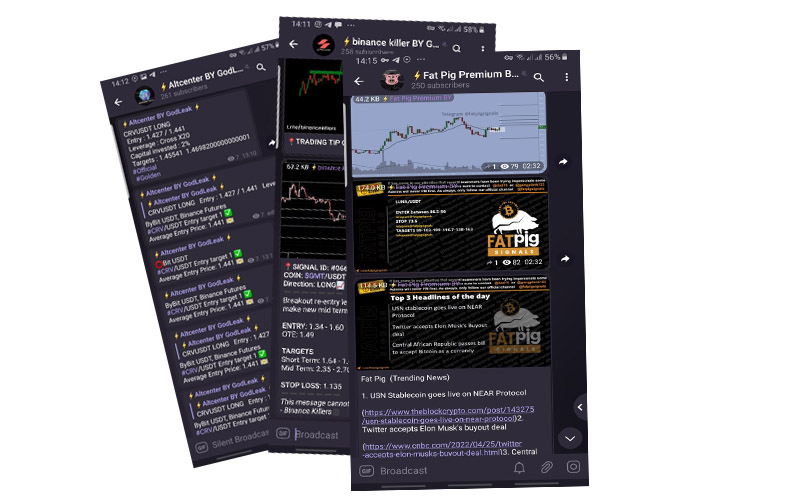
Get to know Godleak
Godleak crypto signal is a service which provide profitable crypto and forex signals. Godleak tried to provide you signals of best crypto channels in the world.
It means that you don’t need to buy individual crypto signal vip channels that have expensive prices. We bought all for you and provide you the signals with bot on telegram without even a second of delay.

Godleak crypto leak service have multiple advantages in comparision with other services:
- Providing signal of +160 best crypto vip channels in the world
- Using high tech bot to forward signals
- Without even a second of delay
- Joining in +160 separated channels on telegram
- 1 month, 3 months , 6 months and yearly plans
- Also we have trial to test our services before you pay for anything
For joining Godleak and get more information about us only need to follow godleak bot on telegram and can have access to our free vip channels. click on link bellow and press start button to see all features
Join for Free
☟☟☟☟☟
https://t.me/Godleakbot
Also you can check the list of available vip signal channels in the bot. by pressing Channels button.
Kaspa price analysis
Kaspa (KAS) surged above the $0.15 overhead resistance on Feb. 17, indicating the resumption of the uptrend.
The upsloping 20-day EMA ($0.13) shows an advantage to buyers, but the overbought levels on the RSI suggest that the rally may have run up too fast in the near term. If the price turns down from the current level, it is likely to find support at $0.15. A solid rebound off this level will enhance the prospects of a rally to $0.20.
On the other hand, if the price turns down sharply and breaks below $0.14, it will signal that the uptrend may have ended in the near term. The KAS/USDT pair could then plummet to the 50-day SMA ($0.11).
The 4-hour chart shows that the pair is facing resistance at $0.17, but a positive sign is that the bulls have not allowed the price to dip below the 20-EMA. The upsloping moving averages and the RSI near the overbought zone indicate advantage to buyers. If the price rises above $0.17, the uptrend could continue to $0.20.
The buyers are expected to defend the zone between the 20-EMA and the 50-SMA on any correction. A break below the 50-SMA may suggest that the bears are back in the driver’s seat.
VeChain price analysis
VeChain picked up momentum after breaking above the 50-day SMA ($0.03) on Feb. 12, indicating aggressive buying by the bulls.
The VET/USDT pair broke above the $0.04 overhead resistance on Feb. 15, signaling the start of the next leg of the uptrend. However, the long wick on the Feb. 16 candlestick shows that the bears are trying to halt the up move near $0.05.
If buyers do not give up much ground, the possibility of the continuation of the up move increases. If the price closes above $0.05, the pair may soar to $0.07.
Contrary to the assumption, if the price continues lower and breaks below $0.04, it will indicate that the bulls are rushing to the exit. The pair may then slump to the moving averages.
The bulls are trying to arrest the pullback at the 20-EMA on the 4-hour chart. If the price turns up from the current level and breaks above $0.05, it will indicate that the sentiment remains positive and traders continue to buy on dips.
Instead, if the price breaks below the 20-EMA, it will suggest profit booking by the bulls. If the price maintains below the 20-EMA, the pair could plunge to the 50-SMA. A deeper fall is likely to delay the start of the next leg of the rally.
Render price analysis
Render (RNDR) broke and closed above the $5.28 overhead resistance on Feb. 15, indicating the resumption of the uptrend.
The bears tried to pull the price back below the breakout level on Feb. 17, but the bulls held their ground. This indicates that the buyers are trying to flip the $5.28 level into support. If they succeed, the RNDR/USDT pair could rise to the pattern target of $7.
The rally of the past few days pushed the RSI into the overbought zone, indicating the possibility of a minor correction or consolidation. A break and close below $5 will be a sign of weakness and may trap the aggressive bulls. The pair could then plunge to the 50-day SMA ($4.34).
The moving averages on the 4-hour chart are sloping up, and the RSI is near 60, indicating that the bulls have the upper hand. If the price rises above $5.71, the pair could rally to $6. The trend will favor the bulls if the price remains above the 20-EMA.
The RSI is forming a negative divergence, indicating that the bullish momentum could be slowing down. If the price skids below the 20-EMA, the decline is likely to reach the 50-SMA. A break below this level may open the doors for a fall to $4.40.


